Empowering Communities
We empower communities – from neighborhoods to regions – to use maps and spatial analysis to better understand their social landscape and to build a more just society.
Syracuse Community Geography is a university-community collaboration that uses GIS mapping and spatial analyses to provide fresh and insightful perspectives on social issues. We are committed to addressing community challenges that relate broadly to the themes:
Health inequalities
and disparities
Neighborhood
planning
and empowerment
Asset-based
community and
economic development
We empower communities – from neighborhoods to regions – to use maps and spatial analysis to better understand their social landscape and to build a more just society.
Geography is critical to understanding people's connection to their social and physical environments. We seek to make the knowledge and tools of geographers relevant and accessible to everyone.
Our research addresses questions relevant to local communities. Our process ensures that all participants both contribute and gain knowledge and skills. Our results inform action.
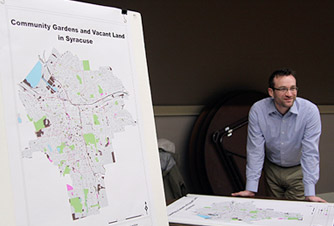
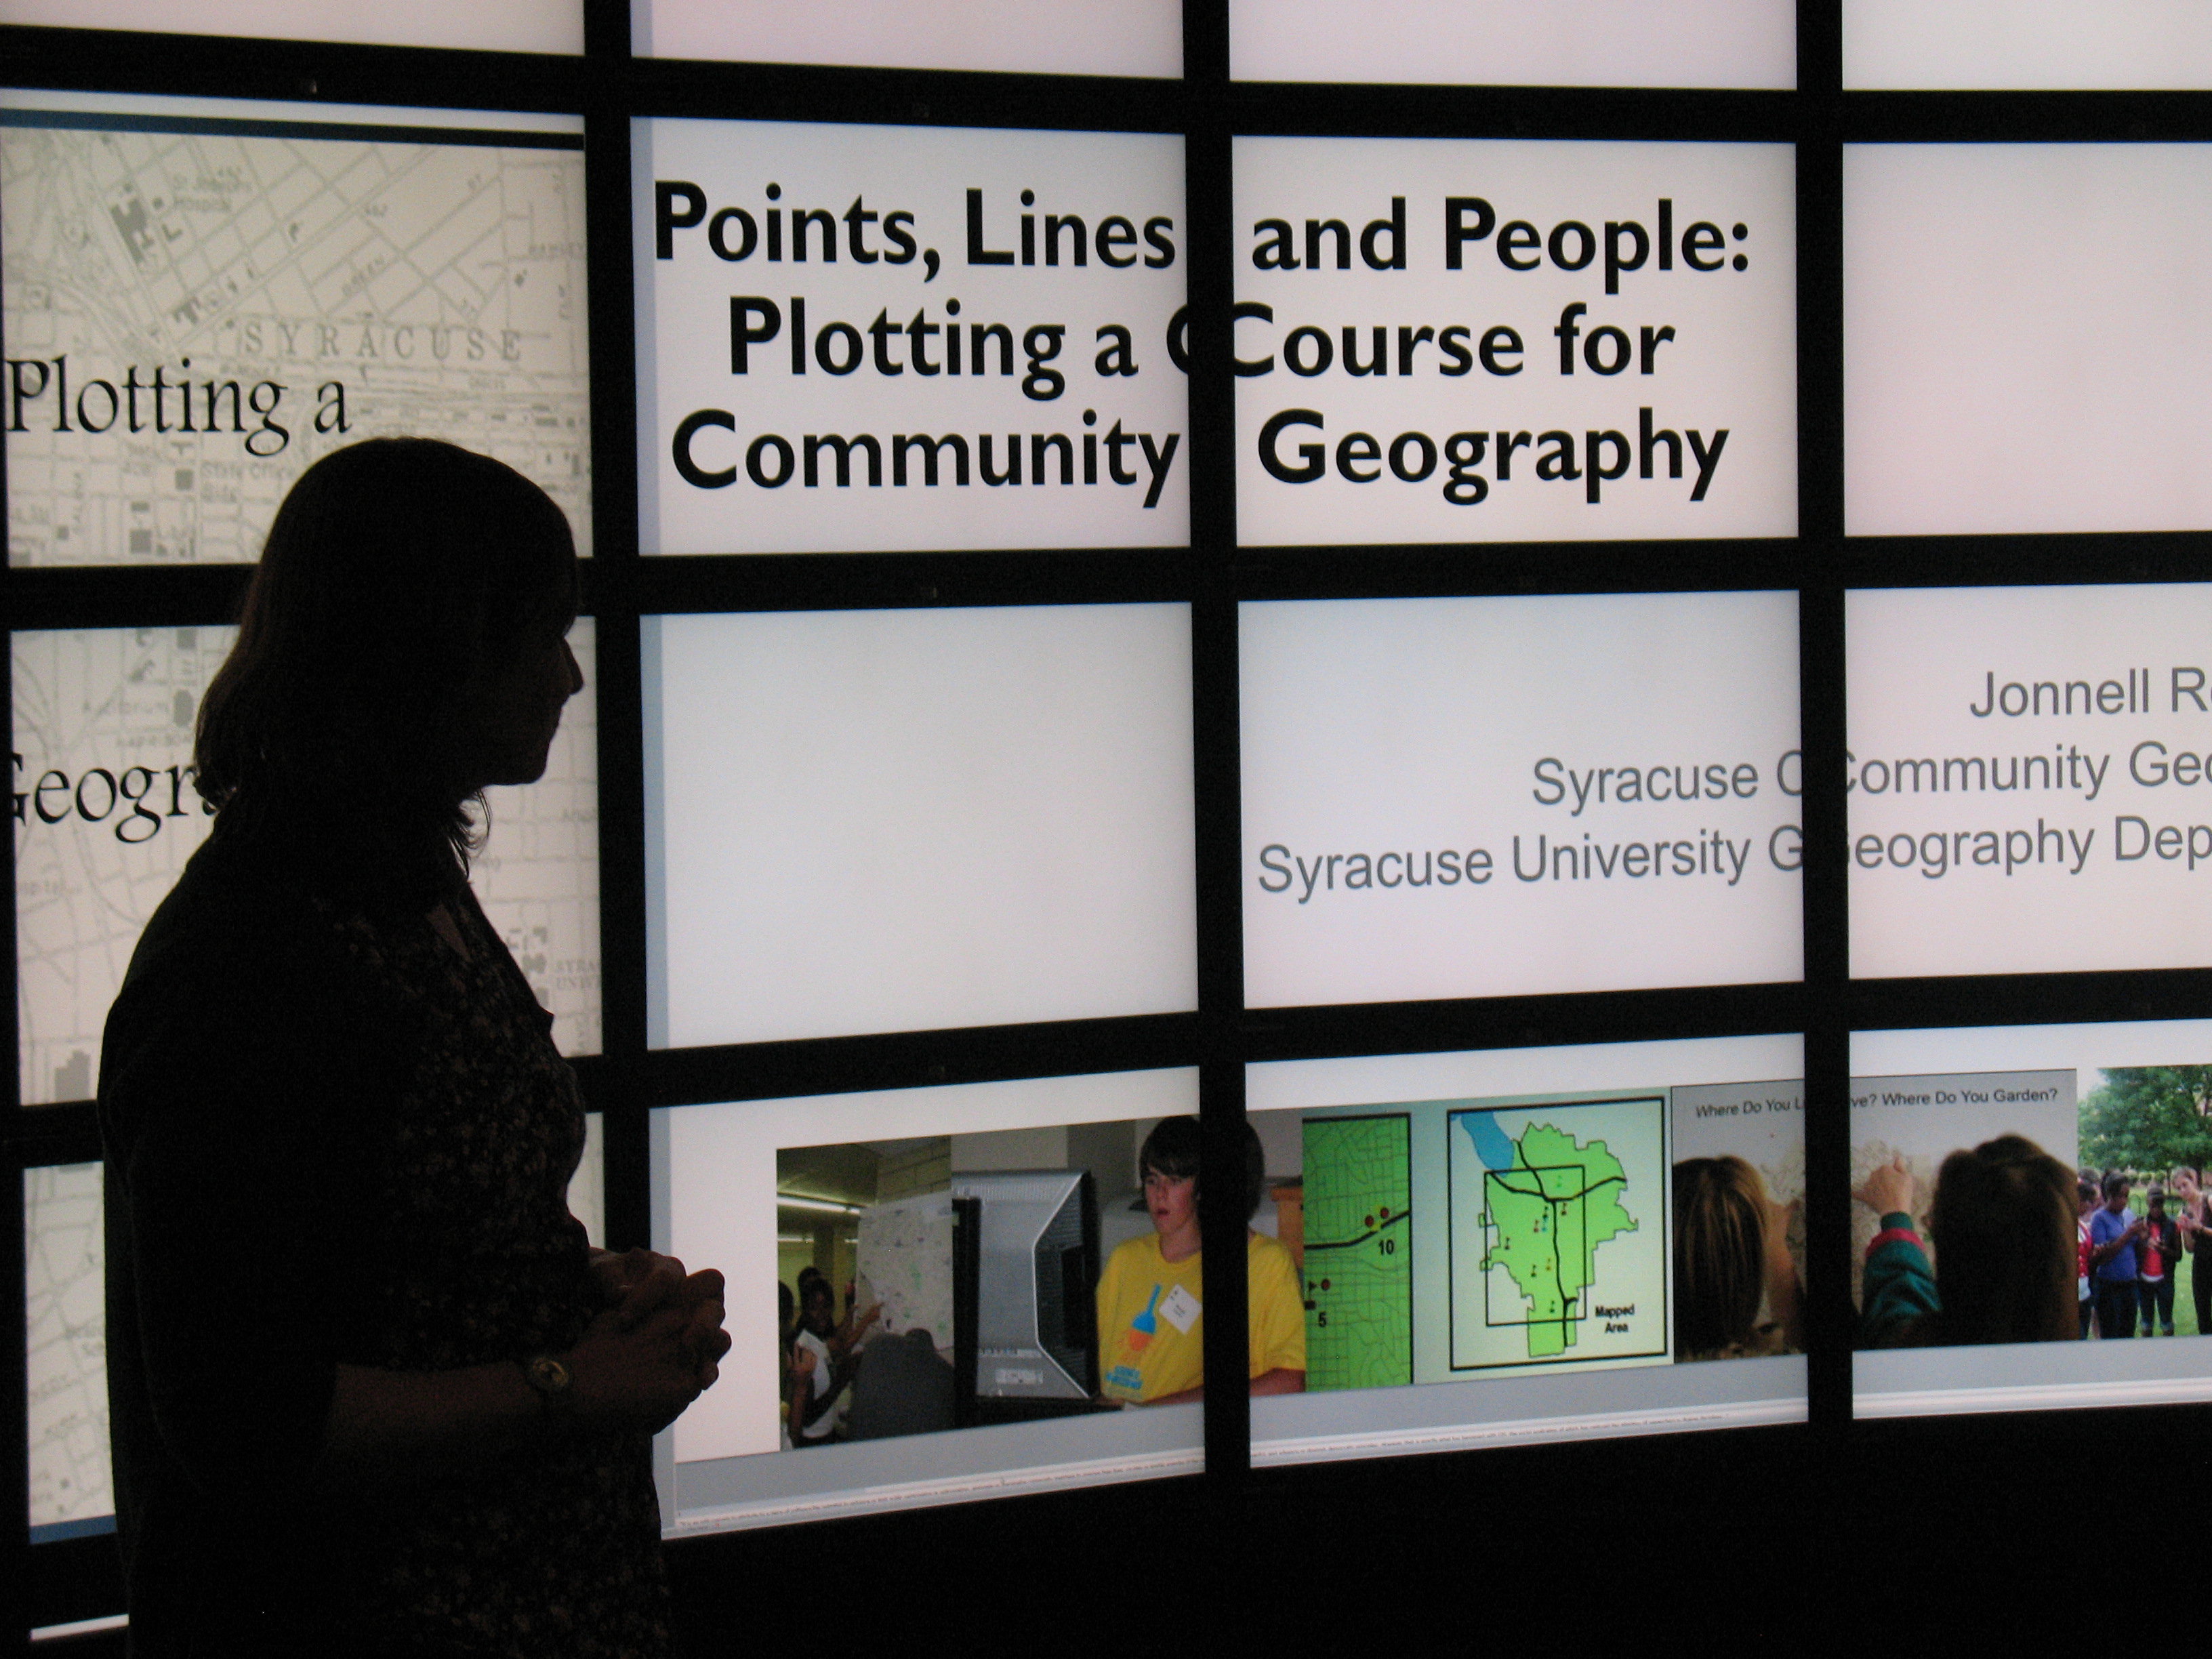
The impetus for creating Syracuse Community Geography came out of a partnership between members of the Syracuse Hunger Project and the Syracuse University Geography Department. In 2003, Dale Johnson, former director of the Samaritan Center, approached SU Geography Professor Don Mitchell to inquire if the Geography Department could map the community’s emergency food distribution network in conjunction with people living in poverty and other factors that may indicate people are hungry. The Syracuse Hunger Project was initiated by Johnson to provide a forum for dialogue among the city’s emergency food service providers. Johnson was concerned that because so many different service providers operate in isolation, that they collectively had little knowledge of the big picture of hunger in the area. Johnson was interested to know if geographers could provide a view from “10,000 feet up”. Mitchell put Johnson in touch with Professor Jane Read, who incorporated the request into an introductory GIS course. Students in the class used GIS to map families living in poverty, social service program recipients, food pantries, soup kitchens, youth and elderly food support program locations, and analyzed patterns to shed light on the geography of need and emergency food provision.
When the analysis was complete the Syracuse Hunger Project hosted a town hall style gathering to publicly announce the results and recommendations. Service providers, community residents, activists, academics, and the media attended. In addition, a final report was issued in April 2004 by the Syracuse Hunger Project. Among the many recommendations issued was one that encouraged the SU Geography Department to create a permanent initiative to provide GIS mapping assistance to community-based organizations that could benefit from geographic analysis of a broad spectrum of community issues. Soon thereafter, a core working group of Geography Department faculty, Syracuse Hunger Project participants, and a local charitable organization created a Community Geographer staff position at Syracuse University. They hired Jonnell Allen Robinson in 2005 as the first Community Geographer.
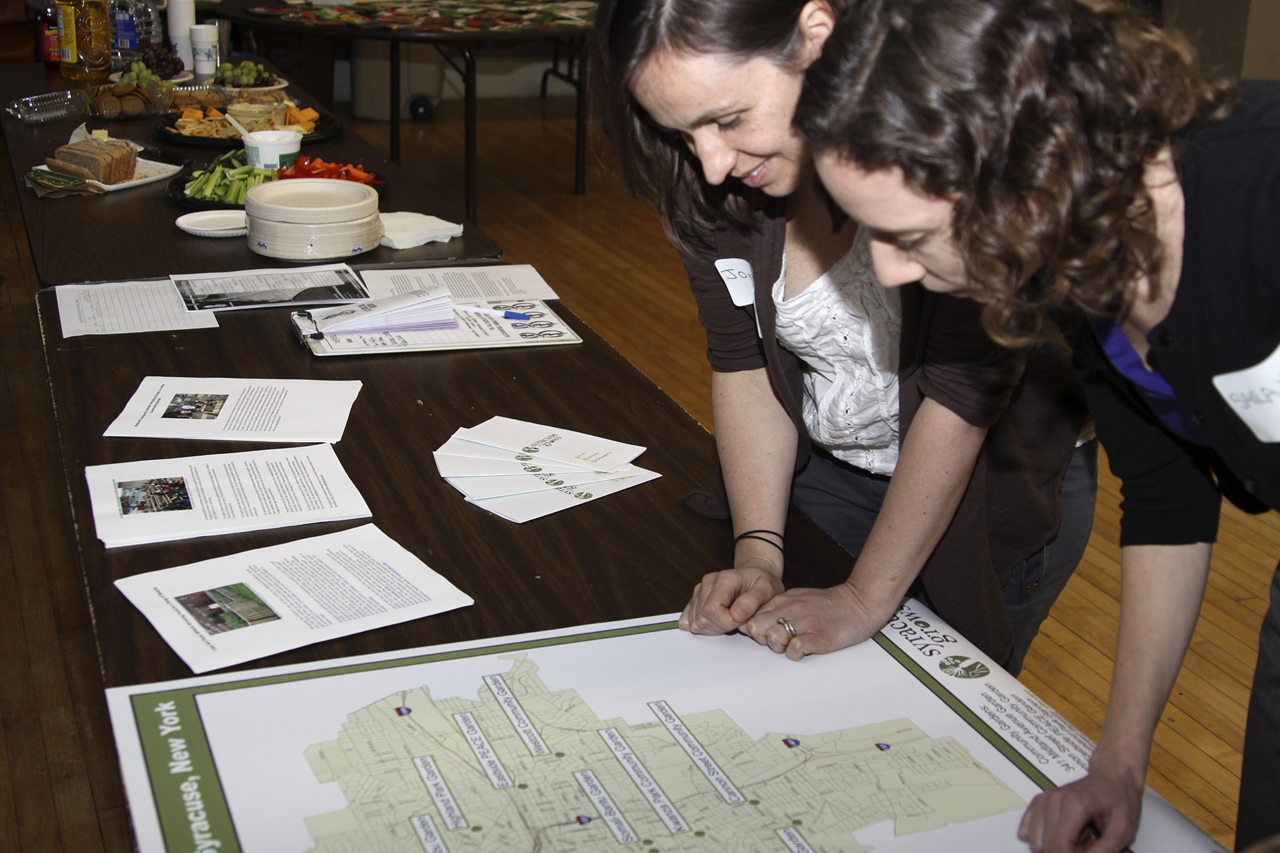
In her first year, Robinson continued to work with members of the Syracuse Hunger Project to further analyze hunger and began creating the framework for the Syracuse Community Geography (SCG) program with the help of her advisory board. She also tackled new community-driven projects including an analysis of youth programming availability and created an interactive mapping tool for the community (MapSyracuse). Since 2005, Syracuse Community Geography has worked with more than 100 community organizations and coalitions on issues ranging from safe routes to school to hydrofracking. In the process, new and lasting collaborations have been created, new ways of understanding significant community problems have evolved, and real changes have been made. Community partners report that over the four years between $3.5 million and $4.5 million dollars in new grants have been secured due in whole or part to SCG analyses. In 2008, Robinson helped members of the Syracuse Hunger Project to create Syracuse Grows – an urban community gardening and food justice organization. Robinson served as chairwoman for the all-volunteer group until 2012, during which time several new urban gardens were established in low income neighborhoods.
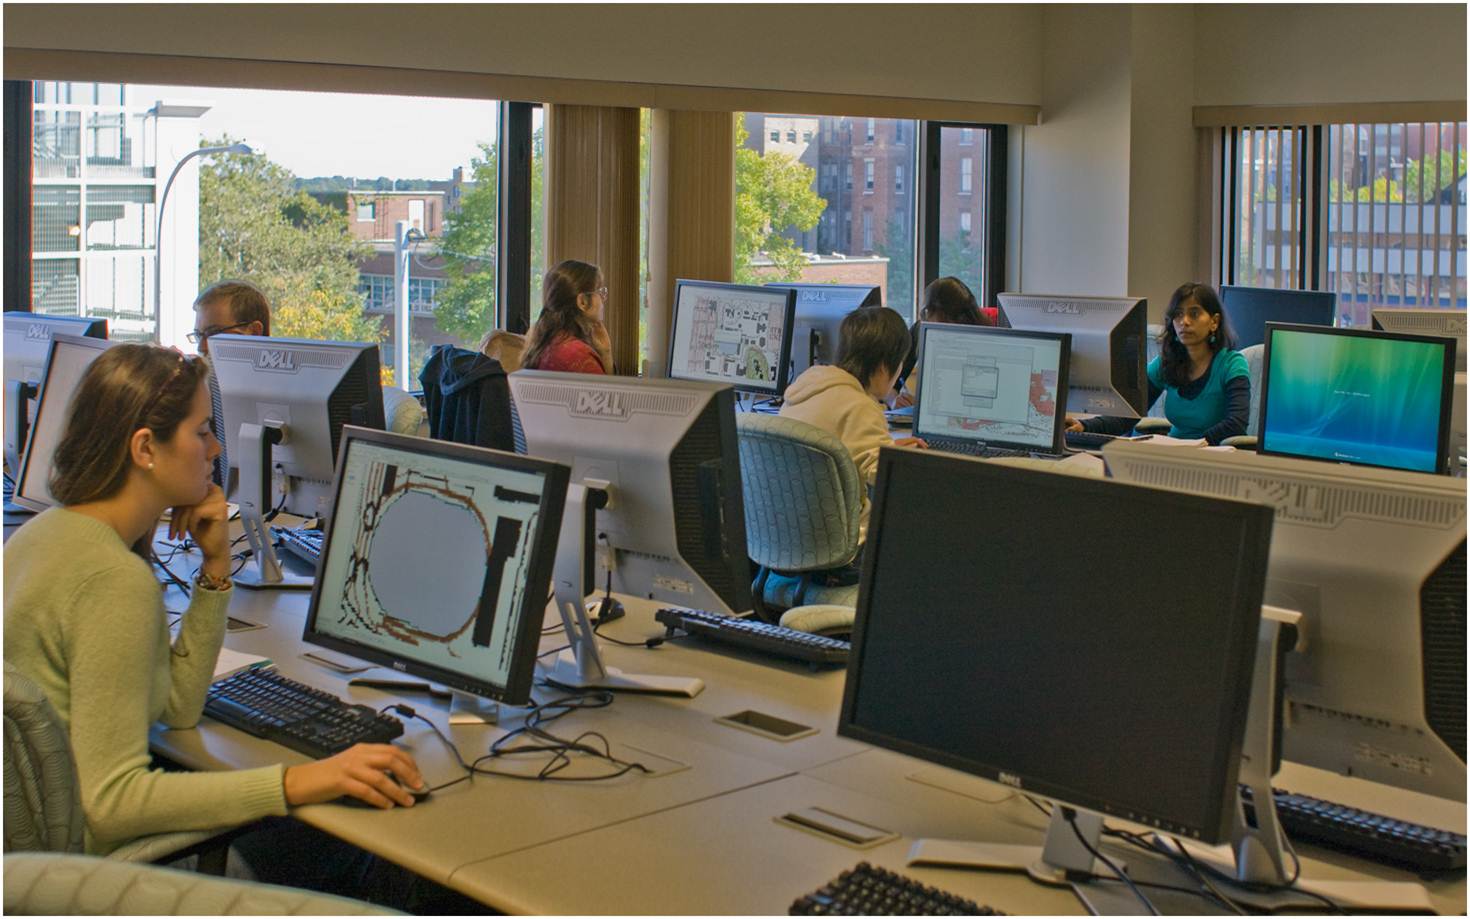
SCG also trains youth, government, school district and nonprofit agency employees, as well as SU faculty and students to use GIS, GPS, Google Earth, MapSyracuse, and to conduct geographic research. Workshop evaluations show that the trainings improve participants’ ability to comprehend complex social and geographic information and equip them with tools to better address community problems. SCG has become an important source of capacity building in the community.
Another momentous milestone was achieved in 2010 when Robinson successfully defended her PhD dissertation research. Her research evaluated the contributions of SCG to the community and university. Soon after, the Geography Department, Chancellor’s office and the SCG advisory board decided that bringing SCG more formally into the teaching and research fold of the department and university would further expand its impact on community groups and students alike. A faculty position and graduate research assistantship in Community Geography was created, enabling Robinson to develop community geography courses and to recruit graduate students interested to pursue research in this growing field. In 2013, the Syracuse Community Geography Program was rebranded: we launched this great new website to showcase projects and to share maps and data. Student involvement continues to grow through our new internship program, courses and the funded graduate research assistantship. We look forward to making an even bigger impact in the years to come.
Simply complete and submit the project request form. If you are unsure how mapping can benefit your organization or project, complete as much of the form as you can. We will contact you by phone to further discuss your ideas and to explore the possibilities.
The Syracuse Community Geography Program is situated within the Geography Department at Syracuse University.
In 2005, Jonnell Allen Robinson was hired as the first “community geographer”, a staff position. In 2012, the Geography Dept. created a tenure track assistant professorship in Community Geography. For the full history, go to the History section.
The Gifford Foundation, in collaboration with the Syracuse University Chancellor’s Office, the Maxwell School of Citizenship and Public Affairs and Geography Department provided startup funding for SCG. Since then, SCG has received funding from the Central New York Community Foundation, the Allyn Foundation, the Kauffman Foundation, and the Horowich Family Foundation. In 2011, the SU Chancellor’s Office generously provided permanent funding for SCG and subsequently provided funding for the assistant professorship. The Maxwell School funds the Syracuse Community Geography Graduate Research Assistantship and the Syracuse University Shaw Center for Public and Community Service supports one undergraduate intern each year. The Geography Department continues to cover operating expenses.
The SCG advisory committee is a voluntary group that is representative of the Syracuse community. Local residents, members of local foundations and charitable organizations, social service agencies, and SU faculty, staff and students comprise the advisory committee. The committee is charged with raising awareness about SCG, establishing community connections, prioritizing and selecting project proposals, assessing and evaluating performance and outcomes, and assisting with fundraising.
Most of the time, maps are created using Geographic Information Systems (GIS) technology. The software used is ESRI’s ArcGIS. Final maps and datasets are made available to project partners in digital and hard copy format.
Geographic Information Systems (GIS) is a computer-based technology that integrates geographic information with information from databases to facilitate the management, analysis, and display of georeferenced data—data that can be linked to a place on the earth’s surface. Virtually all data are spatial—where you live and work, schools, businesses, highways, parks, forests, etc. The information stored in databases, referred to as attribute data, typically contain a mapable entity and its associated characteristics (e.g. a health center, the services it provides, and the hours of operation). Attributes stored in the “geo”databases, and can be queried, analyzed, and edited, similar to data stored in a regular database, but GIS database manipulations can be reflected in maps because they contain a geographic reference.
Typically, GIS databases contain information that is thematically similar and represent individual “layers” of a GIS map. For example, one database may contain residential address information, including the number of household occupants, the ages of the residents, and the household median income. A second database may contain information on all schools, including graduation rates. Each thematic layer can be mapped separately to show their locations, or the various themes can be overlaid with one another to show patterns and geographic relationships (e.g. school locations, their average graduation rates and the median household income of the neighborhoods surrounding the schools).
A GIS is most often associated with maps. A map, however, is only one way to work with geographic data in a GIS, and only one type of product generated by a GIS. This is important, because it means that a GIS can provide a great deal more problem-solving capabilities than simply adding data to a map.
We do occasionally offer GIS short courses for members of community-based organizations and municipal agencies. Contact us for details. Syracuse University and SUNY ESF offer semester long GIS courses. ESRI provides self-paced online GIS training courses for a variety of its software programs and applications. If you are a student, staff or faculty member of SU or SUNY ESF, many of ESRI’s online training courses are free. Contact John Olson, GIS Librarian, in the Bird Library for more information about how to enroll in ESRI tutorials or visit www.ESRI.com.
SCG offers a variety of workshops for community members and youth. We provide workshops to teach people to use MapSyracuse, US Census Bureau data, Google Maps and Google Earth, and GPS (Global Positioning Systems).
MapSyracuse is our new interactive web-based mapping tool containing mapped data specific to Onondaga County, NY. MapSyracuse is powered by Esri’s ArcGIS Online and is a free resource that allows users to select from over 100 layers of data to create, save and print customized maps at scales ranging from a neighborhood block to the county. Click here to read our tutorial.
Spatial analysis can add a new perspective to community challenges. Whether mapping the landscape of food insecurity or public transportation routes, maps shed light on issues such as where there are gaps in service coverage or whether services are accessible via public transportation. Participatory GIS and community mapping can often facilitate broader participation in planning processes because participants are able to visualize a challenge and its possible solutions. For this reason, spatial visualization and GIS analytical tools present a unique opportunity for enhanced citizen involvement in public policy and planning issues. Oftentimes, maps can facilitate mutual understanding and common agreement about basic facts and can be used to develop trusting relationships across a diverse set of participants.
We work on projects of all sizes. Numerous projects have been small, entailing the production of “one-off” maps related to a community issue. Others have been large-scale collaborative projects that have brought together new coalitions to examine such topics as adult literacy.
Yes! Community members, students and faculty are welcome to assist with projects. Members of the community can contact us directly here.
Please contact us to learn more about sponsorship opportunities.